Spreadsheets. For decades, they’ve been the trusty workhorses of data analysis, financial modeling, and project tracking. Tools like Microsoft Excel and Google Sheets are ubiquitous, powerful, and familiar. But what if the familiar grid could do more? What if it could natively understand code, leverage AI for insights, create stunning interactive visuals, and handle massive datasets in your browser without breaking a sweat?
The spreadsheet is evolving, and Quadratic is showing us what’s possible. Let’s dive into some key features that are redefining what we can expect from our rows and columns.
1. Unleash the Power of Code, Directly in Your Cells
Traditional spreadsheets rely on built-in formulas or separate scripting environments like VBA or Google Apps Script. While powerful, these can sometimes feel limiting or cumbersome for complex tasks.
Imagine, instead, writing Python – complete with libraries like Pandas for data manipulation or Plotly for visualization – directly within a spreadsheet cell. Picture running SQL queries against connected databases or leveraging JavaScript for custom logic, all within the same grid interface.
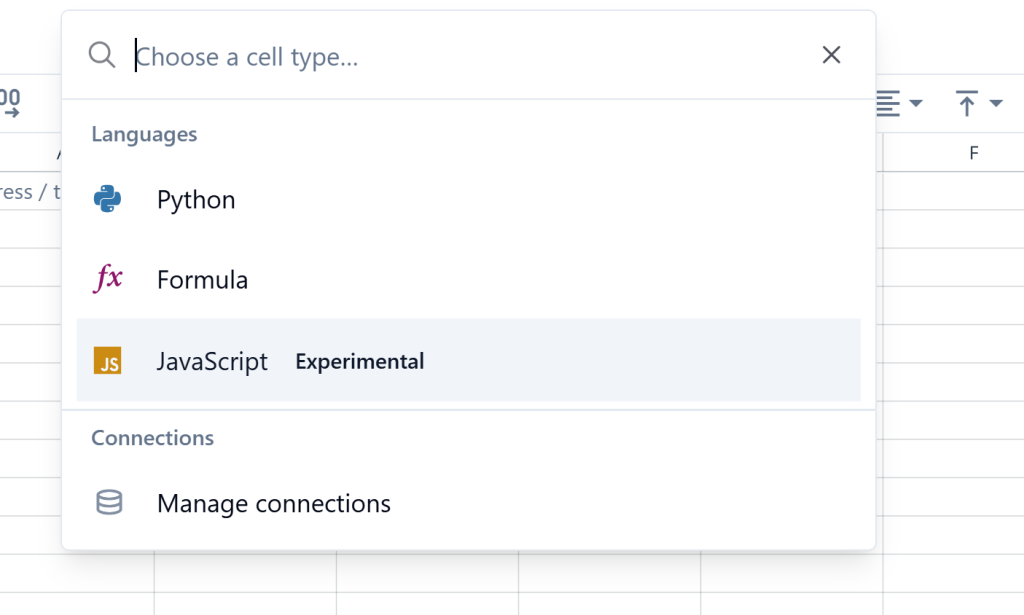
This native coding power unlocks:
- Advanced Automation: Go beyond simple macros to script complex workflows.
- Sophisticated Analysis: Perform statistical modeling, data cleaning, and transformations using familiar programming languages.
- Seamless Data Integration: Write code to fetch data directly from databases or web APIs, keeping your analysis live and up-to-date without manual imports.
- Clarity: Multi-line code blocks in cells can be easier to read and debug than complex, nested formulas.
For anyone who’s ever hit the limits of VLOOKUP or wished they could just run a quick Python script on their data, this built-in coding capability is a game-changer.
2. Your Spreadsheet’s Intelligent Assistant: Seamless AI Integration
Artificial intelligence is transforming industries, and spreadsheets are no exception. While some platforms are adding AI features, integrating them seamlessly into the workflow is key.
Modern spreadsheets are embedding AI directly, allowing you to:
- Chat with Your Data: Ask questions in natural language (“What were the top 5 performing products last quarter?”) and get insights or even generate charts instantly.
- AI-Assisted Code Generation: Get help writing formulas or code snippets to perform specific tasks.
- Automated Analysis: Use AI to summarize data, identify trends, detect anomalies, or even generate synthetic data for testing models.
Instead of exporting data to a separate AI tool, imagine having that intelligence right beside your data, ready to assist, accelerate analysis, and uncover hidden patterns.

3. Data That Comes Alive: Advanced & Dynamic Visualizations
Static bar charts and pie graphs have their place, but sometimes data needs to tell a more interactive story. While traditional tools offer standard charting, modern platforms are pushing the boundaries.
Look for capabilities like:
- AI-Powered Charting: Generate visualizations simply by describing what you want (“Create a scatter plot of sales vs. marketing spend”).
- Direct Integration with Viz Libraries: Use the power of Python libraries like Plotly or Matplotlib directly within the spreadsheet to create sophisticated, interactive, customizable charts that go far beyond standard options. Imagine embedding interactive maps, heatmaps, or complex dashboards directly within your analysis flow.
This allows for more compelling data storytelling, deeper exploration through interaction, and visuals tailored precisely to your needs.

4. Peak Performance Meets Effortless Collaboration
The shift to web-based tools brought incredible benefits for collaboration. Google Sheets pioneered real-time, multi-user editing. Modern platforms build on this, ensuring seamless teamwork without version control headaches.
But collaboration is only part of the equation. Performance, especially with large datasets in a browser, can be a challenge for web-based tools. This is where modern architecture comes in. By leveraging technologies like:
- WebGL: For fast, hardware-accelerated rendering of the grid (like in gaming).
- WebAssembly (WASM) & Rust: For running complex calculations efficiently in the browser.
Quadratic aims to deliver a smooth, responsive experience even with hundreds of thousands of rows, bridging the performance gap often felt between powerful desktop applications and convenient web-based tools. You get the accessibility and collaboration of the web, potentially without the performance penalty on large files.
The Spreadsheet, Reimagined
The spreadsheet isn’t just about static grids anymore. It’s becoming an integrated environment for coding, AI-driven analysis, dynamic visualization, and high-performance collaboration. Quadratic is showcasing this evolution, offering a glimpse into a future where our data tools are more powerful, intelligent, and flexible than ever before.
If your current spreadsheet workflow feels limiting, it might be time to explore what these next-generation tools can offer.
Ready to see the future of spreadsheets? Check out Quadratic
This post is sponsored by Quadratic. I was compensated for writing this review